Statistics
The Statistics view turns application telemetry into a customizable dashboard. Use it to establish a baseline, compare releases, identify affected environments, and select a time window for deeper investigation.
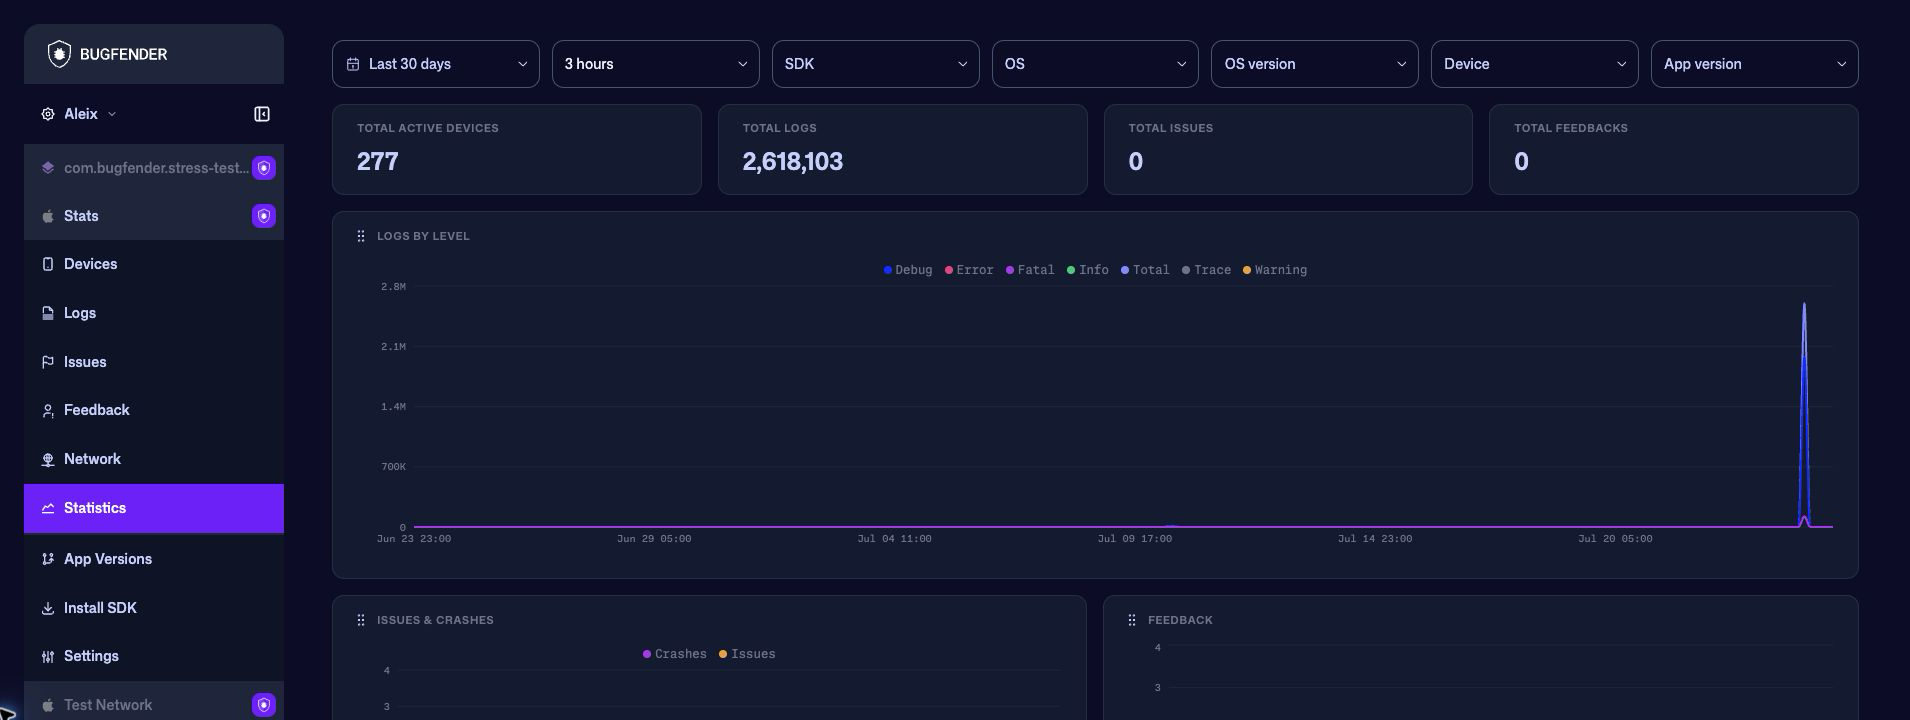
Set the time window
Choose a date preset or an absolute range, then select how the charts group events:
| Interval | Useful for |
|---|---|
| Hourly or 3 hours | Investigating a short incident or a recent release. |
| Daily | Comparing activity across several weeks. |
| Weekly or Monthly | Looking for longer-term adoption and reliability trends. |
Bugfender disables intervals that would create too many chart buckets. When you expand the date range beyond the selected interval's supported resolution, the dashboard automatically switches to a coarser interval.
Zoom into an incident
Drag horizontally across Logs by level, Issues & crashes, or Feedback to replace the current date range with the selected chart window. This is useful when a wide range reveals a spike and you want to inspect it at a finer resolution.
Filter every panel
The filters apply to the summary and every chart:
- SDK
- OS
- OS version
- Device
- App version
Each filter accepts multiple values. The date range, interval, and selected filters are stored in the page URL, so you can bookmark the view or share the same comparison with a teammate who has access to the application.
Read the summary
The cards at the top summarize the filtered window:
| Metric | Meaning |
|---|---|
| Total Active Devices | Distinct devices active at least once in the entire selected window. |
| Total Logs | Log lines received in the selected window. |
| Total Issues | Issues and crashes combined. |
| Total Feedbacks | User-feedback submissions received in the selected window. |
Total Active Devices is a distinct count for the complete window. Do not add the values in the Active devices chart: a device can be active in more than one time bucket.
Explore the charts
| Panel | What it shows |
|---|---|
| Logs by level | Total, trace, debug, info, warning, error, and fatal log volume. |
| Issues & crashes | Issues and crashes as separate series. |
| Feedback | User-feedback submissions over time. |
| Active devices | Distinct active devices in each time bucket. |
| Crash-free devices | Percentage of active devices with no crash in each time bucket. |
| App version adoption | Device share for the ten most-used application versions in each time bucket. Every stacked bar represents 100% of the observed devices. |
| Top OS versions | The operating-system versions used by the most devices. |
| Top devices | The most frequently observed device models. |
Hover a time-series chart to inspect the bucket's values. The cursor and tooltip are synchronized across the time-series panels, making it easier to compare logs, crashes, feedback, and device activity at the same moment.
Select a legend item to hide or restore that series. For example, hide Total, Trace, and Debug in Logs by level to make error and fatal trends easier to compare.
Customize the dashboard
- Drag a panel using the grip next to its title.
- Resize a panel from its lower-right edge.
- Scroll to load panels farther down the dashboard.
The arrangement is saved in the current browser and reused across applications. Resizing a chart does not change its data or filters.
Compare a release
- Set a period that includes time before and after the release.
- Use App version adoption to confirm how quickly the release reached active devices.
- Filter App version to the new version.
- Compare Crash-free devices, Issues & crashes, and high-severity logs with the previous version or baseline.
- Drag across an abnormal period to zoom in.
- Open Issues or Logs to inspect the underlying events.
If the summary changes unexpectedly after applying a filter, check the adoption and device panels before drawing a conclusion. A release can appear healthier simply because only a small share of devices has received it.